Let’s start by defining a conversion
What we mean when we talk about conversion is when a visitor to your website takes an action that you want them to take. But what does that look like to you? It could be signing up for an email newsletter, creating an account with a login and password, making a purchase, downloading your app, calling your office (with a tracking #)or something else entirely. Whatever it is you want your visitors to do, this action is what you are going to measure and what you are looking to optimize.
CONVERSION MARKETING
Online marketing is more than just having a nice website. It is set of strategies that are designed to bring people to your website and convert them to customers. Millions of people are using the Internet each today to search for things they need. People in your community are searching for the products and services you provide. Internet marketing makes sure that when someone types a keyword into a search engine that is relevant to your business, your website appears at the top of the search results.
CONVERSIONS AND “LEADS”
Organic traffic: Organic traffic refers to visitors clicking through to your website after searching for a keyword you’re currently ranking for. Upon searching for that term on a search engine like Google or Bing, users who click upon a link that shows up on that search engine result page (and is not a paid ad), then link to your website are considered “organic traffic.”
Lead: The term “lead” actually means three different things: sales qualified leads, marketing qualified leads, and plain old leads, who may be someone who’s filled out a non-specific form on your website a while back, but hasn’t been very active recently. For our purposes, a lead is anyone who has provided at least their email address on a website form.
Conversion Rate: here, we’re going to focus on visit-to-lead conversion rate, or the percentage of website visitors who fill out a form and convert into, or become, a lead
Few Key Terms To Know
These are concepts and ideas that will come up again and again in this guide, so now is the time to familiarize yourself with them.
So…What is a Good Conversion Rate?
Here’s an overview of the things you are going to measure in order to gauge your current rate of conversion, identify the trouble spots, and design a plan of action. You can get these numbers through Google Analytics, KISSmetrics, or another analytics service of your choosing. The numbers critical to CRO are as follows:
Conversion Rate Overview
Hint: it’s a lot higher than you may think.
Conventional wisdom says that a good conversion rate is somewhere around 2% to 5%. If you’re sitting at 2%, an improvement to 4% seems like a massive jump. You doubled your conversion rate! Well, congratulations, but you’re still stuck in the average performance bucket.
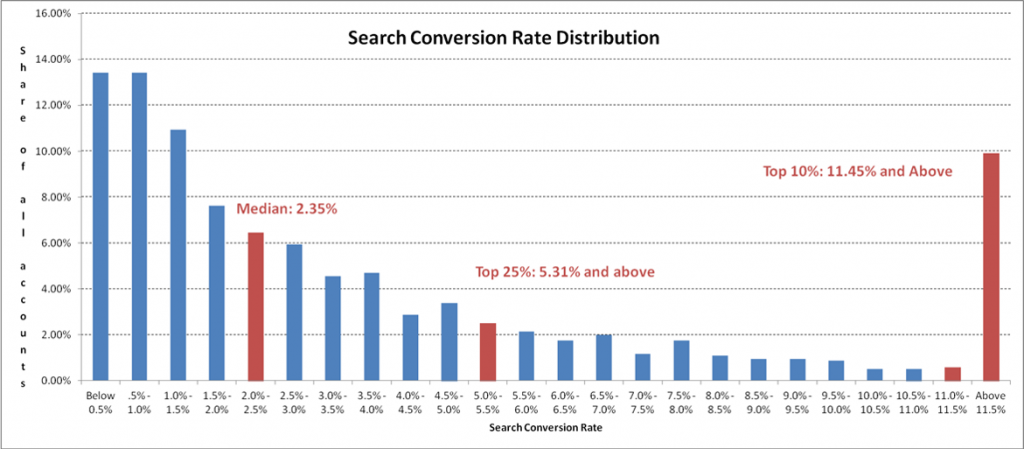
In this analysis, we started with all accounts we can analyze and went back a period of 3 months. We removed those that didn’t have conversion tracking set up properly, those with low conversion volumes (<10 conversions/month), and low volume accounts (<100 clicks/month), leaving hundreds of accounts for our analysis. We then plotted where the accounts fit in terms of conversion rate.
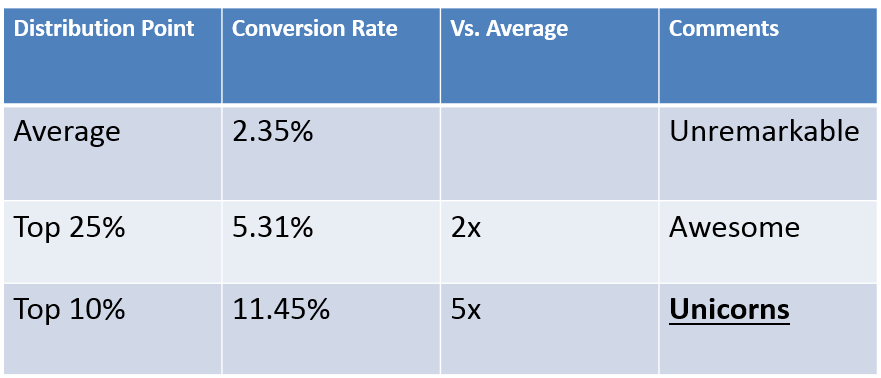
So what is a good conversion rate? About 1/4 of all accounts have less than 1% conversion rates. The median was 2.35%, but the top 25% of accounts have twice that – 5.31% – or greater. Check out the far right red bar – the top 10% of AdWords advertisers have account conversion rates of 11.45%.
Remember, this isn’t for individual landing pages – these advertisers are accomplishing 11.45% conversion and higher across their entire account.
Clearly, this isn’t some anomaly; this is perfectly attainable. If you’re currently getting 5% conversion rates, you’re outperforming 75% of advertisers … but you still have a ton of room to grow!
You should be shooting for 10%, 20%, or even higher, putting your conversion rates 3x to 5x higher than the average conversion rate. Aspire to have these landing page conversion rate unicorns in your account.


But Conversion Rates Are Lower in My Industry…
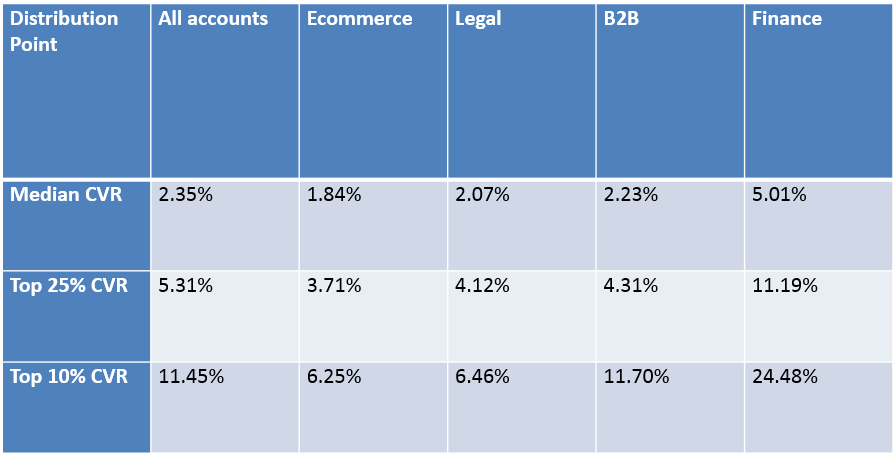
That’s entirely possible. We segmented conversion rate data by industry to see whether these insights held true for all marketers. Here’s what we found in an analysis of four major industries:

